Monitor your cluster of Tomcat applications with Logstash and Kibana
Posted: March 2, 2013 Filed under: AdminSys, Linux | Tags: devops, elasticsearch, kibana, Linux, logstash, monitorization, tomcat 14 CommentsA month ago I wrote a post about Logstash + ElasticSearch + Kibana potential used all together. Back then the example used was fairly simple, so today’s goal is to see how
one can make the most out of those tools in an IT infrastructutre with real-life problematics. The objective will be to show how to monitor in a central place logs coming from a cluster of tomcat servers.
Problematic : Monitor a cluster of tomcat application
Let’s take a cluster of 3 identical nodes, each of which hosts 3 tomcat applications, this ends up in 9 applications to monitor. In front of these cluster stands a load balancer – so customers can be in any node at any time.
Now if an error happens on the user applications, unless one has a log management system in place, one will need to log into each and every node of the cluster and analyze the logs – I know it can be scripted but you get the point it’s not the optimal way.
This post aims to show how this problem can be tackle using Logstash, Redis, ElasticSearch and Kibana to build a strong – highly scalable and customizable – log management system.
Tools
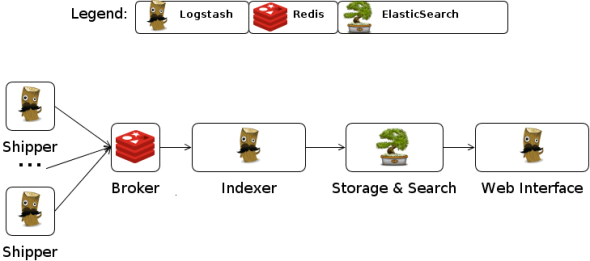
Here we will apply the following scheme from Logstash website. The only difference is that Kibana will be used instead of the embedded Logstash web interface.
What does what
- Logstash: As a log shipper and a log indexer
- Redis : As a broker – used as a queuing system
- ElasticSearch : As a log indexer – store and index logs
- Kibana : As a front-end viewer – a nice UI with useful extra features
Installation
Logstash
Logstash comes as a jar, it is bundled with everything it needs to run.
The jar file is available here
To run it simply execute :
java -jar logstash-1.1.9-monolithic.jar agent -f CONFFILE -l LOGFILE
This will start a logstash instance that will act based on the CONFFILE it has been started with. To make this a bit cleaner, it is recommended to daemonize it so it can be started/stopped/started at boot time with traditional tools. Java-service-wrapper libraries will let you daemonize logstash in no time, traditional initd script works also.
Logstash needs to be installed on both the cluster node (shippers) and the central server where log will be gathered, stored and indexed (indexer)
Redis
Redis is a highly scalable key-value store, it will be used as a broker here. It will be installed on the central location.
Redis installation is pretty straightforward, it has packages available for every main linux distributions. (CentOS user will need to install EPEL first)
- Edit
/etc/redis.conf, changebind 127.0.0.1tobind YOUR.IP.ADDR.ESS - Make sure Redis is configured to start at boot (chkconfig/updated-rc.d)
Important : Make sure a specific set of firewall rules is set for Logstash shipper to be able to communicate with Redis
Elastic Search
Unfortunately ElasticSearch can not be found on package repositories on most Linux distributions yet. Debian users are a bit luckier, since the team at elasticsearch.org provide them with a .deb, for other distributions users, installation will need to be manual. ElasticSearch will be installed in the central location.
Get the source from ElasticSearch.org, and as with Logstash I would recommend to use java-service-wrapper libraries to daemonize it.
You need to edit the configuration file elasticearch.yml and uncomment network.host: 192.168.0.1 and replace it to network.host:YOUR.IR.ADDR.ESS. The rest of the configuration needs to be edited based on the workload that is expected.
Kibana
Kibana does not have packages yet, the source code needs to be retrieved from Github of Kibana website itself. Installation is straight forward
wget https://github.com/rashidkpc/Kibana/archive/v0.2.0.tar.gztar xzf v0.2.0.tar.gz && cd Kibana-0.2.0gem install bundlerbundle installvim KibanaConfig.rbbundle exec ruby kibana.rb
Main fields to configure in KibanaConfig.rb:
- Elasticsearch : the URL of your ES server
- KibanaPort : the PORT to reach Kibana
- KibanaHost : The URL Kibana is bound to
- Default_fields : The fields you’d like to see on your dashboard
- (Extra) Smart_index_pattern : The index Kibana should look into
Kibana will be installed on the central location. Look into `sample/kibana` and `kibana-daemon.rb` for how to daemonize it.
configuration
Tomcat Servers
Here, Logstash will monitor two kinds of logs, the applicactions logs and the logs access
Logs Access
In order to enable logs access in tomcat edit your /usr/share/tomcat7/conf/server.xml and add the AccesLog valve
<Valve className="org.apache.catalina.valves.AccessLogValve" directory="logs"
prefix="localhost_access_log." suffix=".txt" renameOnRotate="true"
pattern="%h %l %u %t "%r" %s %b" />
Application Logs
Here a library that will output log4j message directly to the logstash json_event format will be used – Special thanks to @lusis for the hard work – so no groking will be required
- Jar : jsonevent-layout
- Dependency : json-smart
Configure log4j.xml
Edit the /usr/share/tomcat7/wepapps/myapp1/WEB-INF/classes/log4j.xml
<appender name="MYLOGFILE" class="org.apache.log4j.DailyRollingFileAppender">
    <param name="File" value="/path/to/my/log.log"/>
    <param name="Append" value="false"/>
    <param name="DatePattern" value="'.'yyyy-MM-dd"/>
    <layout class="net.logstash.log4j.JSONEventLayout"/>
</appender>
Logstash file
Shipper
An example of what a Logstash shipper config file could look like
	input {

  		file {
    		  path => '/path/to/my/log.log'
    		  format => 'json_event'
    		  type => 'log4j'
		  tags => 'myappX-nodeX'
  		}

  		file {
    		path => '/var/log/tomcat7/localhost_access_log..txt'
    		format => 'plain'
    		type => 'access-log'
			tags => 'nodeX'
  		}

	}

	filter {

		grok {
			type => "access-log"
			pattern => "%{IP:client} \- \- \[%{DATA:datestamp}\] \"%{WORD:method} %{URIPATH:uri_path}%{URIPARAM:params} %{DATA:protocol}\" %{NUMBER:code} %{NUMBER:bytes}"
		}

		kv {
			type => "access-log"
			fields => ["params"]
			field_split=> "&?"
		}

            urldecode {
                    type => "access-log"
                    all_fields => true
            }

	}

	output {

		redis {
			host => "YOUR.IP.ADDR.ESS"
			data_type => "list"
			key => "logstash"
		}

	}
Indexer
An example of what a Logstash indexer config file could look like
	input {

		redis {
			host => "YOUR.IP.ADDR.ESS"
			type => "redis-input"
			data_type => "list"
			key => "logstash"
			format => "json_event"
		}

	}

	output {

		elasticsearch {
			host => "YOUR.IP.ADDR.ESS"
		}

	}
Testing
- Make sure Redis + ElasticSearch + LogStash(indexer) + Kibana are started
- Make sure all LogStash (shipper) are started
- Go to YOUR.IP.ADDR.ESS:5601 and enjoy a nice structured workflow of logs
The Lucene query language can be used on the header text-box to query/filter results. Kibana will have a new interface soon, that will let one customize an actual dashboards of logs, take a peak at the demo it does look promising.
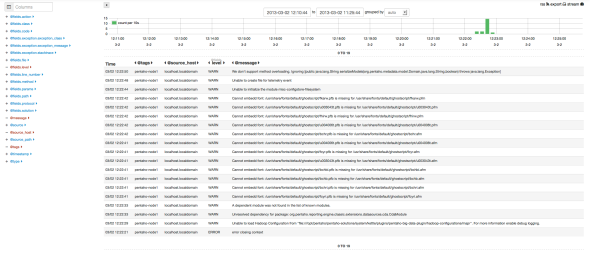
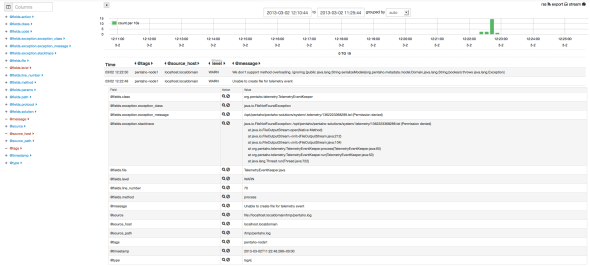
Find below some screenshot (current version of Kibana) of this what the configuration based on this post provide :
Log access analysis

Application log analysis

Application log analysis -details

You can see that their tags are marked ‘pentaho-node1’ so now it is easy to know what application (pentaho) on which node (node1) did produce the error.
Kibana has some excellent features take time to get to know them.
Conclusion
Last month twitter example was not real-life problems oriented, but with this post one can see all the power behind the use of those tools. Once those tools set up correctly one can gather all the logs of a cluster and explore them, one can easily figure out from where issues are coming from and all at a fingertip. QED
