Powerful Analysis Tool using Logstash + ElasticSearch + Kibana
Posted: January 25, 2013 Filed under: AdminSys, Linux | Tags: elasticsearch, kibana, Linux, logging, logstash 6 CommentsReading about Logstash the first time I thought Yet Another Log Management Tool, but I was totally wrong.
As its author claims a log is nothing more than :
date + content = LOG
So sure all our system logs look that way (apache, nginx, mail, mysql, auth, etc…) but not only … What about git commit, tweets, facebook status, Nike+ run, a purchase, etc… ?
- Git : A git commit includes a timestamp with a message + commit details
- Tweet : A tweet is a message posted at a specific point-in-time
- Facebook Status :A facebook status is a message posted at a specific point-in-time
- Nike+ run : A run ends up at a specific point-in-time and convey extra data (Distance, Length, GPS tracks)
- A purchase : A purchase is made at a specific point-in-time and convey extra data (Total amount, quantity of product bought, etc..
So more than a simple log management tool, Logstash with the help of Kibana and ElasticSearch can form a really powerful and fast analysis tool.
Installation & Demo (~10 minutes)
Prerequisite
- Java 1.6+ needs to be installed
- The bundle gem needs to be installed
Download logstash
wget https://logstash.objects.dreamhost.com/release/logstash-1.1.9-monolithic.jar
Create a logstash-twitter.conf
input {
    twitter {
        type           => "twitter"
        user           => "username"
        password       => "password"
        message_format => "json"
        keywords       => ["kibana", "logstash", "elasticsearch"]
    }
}

output {
    elasticsearch {
        embedded       => true
    }
}
Run logstash
java -jar logstash-1.1.9-monolithic.jar agent -f logstash-twitter.conf
Download & Install Kibana
curl -L https://github.com/rashidkpc/Kibana/archive/v0.2.0.tar.gz | tar -xzvf -
cd Kibana-0.2.0
bundle install
ruby Kibana.rb
Now access it via http://localhost:5601/
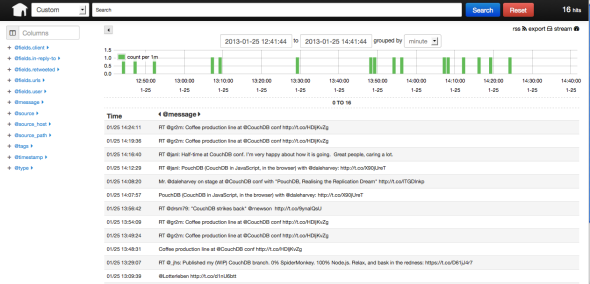
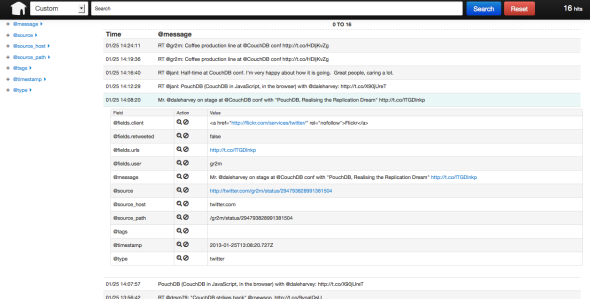
Screenshot (Since today was CouchDB conference in Berlin, I supposed I would have had more input tracking couchdb keyword)
Events list
Event detail
And done, everytime someone tweet about either Kibana, Logstash or ElasticSearch you will have all the information about this tweet in a nice UI
Technical Explanations
Logstash – logstash.net
Logstash works as a pipeline system : inputs | filters | outputs. In our simple example we used only the inputs | outputs pipe. Logstash by default offers 26 different inputs and 45 differents outputs (http://logstash.net/docs/1.1.9/ – at the really bottom). Here the twitter input relies on the Twitter Streaming API to retrieve the tweets with the keywords we mentionned, then send them directly to our ElasticSearch instance to store them and index them.
ElasticSearch – elasticsearch.org
ElasticSearch is a distributed, RESTful, search server based on Apache Lucene. It does fully support the near real-time search of Apache Lucene. Its role here is to index and store all the event that it is feeded with. The server supports the Lucene Query Language.
Note : here the embedded ElasticSearch component is used. I would advise one to set one on its own in an independent manner.
Kibana – kibana.org
Kibana is the UI that sits on top of ElasticSearch. It will give you the interface to explore your data, select them, drill into them, filter them, group them etc… Even though it is pretty basic, it lets you get the most out of your data.
Conclusion
Even if this example is really basic – and mainly useless – it shows you how quickly a powerful analysis tool can be set up using this triplet. If the input you are looking for does not exist yet, simply create it (http://logstash.net/docs/1.1.9/extending/) same thing apply for the output.
Do not forget that everything with a date (specific point-in-time) and a content is in some way a log. Now you know how to analyze and measure it. QED


Very helpful read, but I could not get the twitter example to work. Was I supposed to put my own username and password there or what? Please clarify that. Also, please tell me if you know how to create Kibana dashboards. I cannot seem to do it and have to make one soon. I’m a noob and can’t find the right resources. If you have any idea, please do let me know. Thanks!
Hi Akshay,
Yes you do have to provide your own credential. For Kibana, are you talking about v2 or v3 ?
Any version. I’m using v2 I think. But I just need to know how to actually bring up custom dashboards. The only thing I get now is the default one that searches logstash logs. Thanks!
You can’t do much more than what you see in v2. V3 would be the version to go, if you want more flexible UI. I would recommend http://demo.kibana.org to play with v3 and understand how the blocks works to build a dashboard.
[…] Logstash/Kibana/Graylog: http://linuxdrops.com/log-management-using-logstash-and-kibana-on-centos-rhel-fedora/, https://spredzy.wordpress.com/2013/01/25/powerful-analysis-tool-using-logstash-elasticsearch-kibana/ […]
[…] https://spredzy.wordpress.com/2013/01/25/powerful-analysis-tool-using-logstash-elasticsearch-kibana/ […]